
Context
A LinkedIn content team currently needs to decide which publishing patterns to repeat. It needs an account-level view of recent public posts so recommendations are based on comparable evidence rather than one standout or weak post.
The user's question: “How should this LinkedIn account post for higher engagement, and can high readership be copied directly?”
Compare content types across the returnable post history instead of copying one viral post, and keep missing impressions from being treated as reads.
Answer: Across 95 returnable posts, App rankings averaged 15.3 likes and hashtag-only posts averaged 2.1. Readership cannot be verified because impressions were null on all 50 recent posts.
$research-social-signalsContext
A LinkedIn content team currently needs to decide which publishing patterns to repeat. It needs an account-level view of recent public posts so recommendations are based on comparable evidence rather than one standout or weak post.
What is public
The user authorized publication of redacted engagement metrics, content types and the research conclusion. Account name, profile and company details remain redacted.
Bars start at zero. This is an account-internal comparison, not a LinkedIn benchmark and not readership.
Subject
95 returnable LinkedIn posts
Pagination chain ended
7 posts
14 posts
Reads unverifiable
Labeled by publish date · zero baseline
Copy the highest-readership post directly.
Impressions were missing. The gap is between image-led data rankings and hashtag-only posts.
Retest rankings and single-app cases; stop hashtag-only posts. This is an account ranking, not a platform algorithm rule.
User
@skill:Social Signal Retrieval Analyze the posting activity of this account: https://www.linkedin.com/in/xx. The goal is to find a replicable method for posts with high readership.
SignalDig research agent
Understood. I’ll first run a deep comparison: high- versus low-engagement post characteristics, opening patterns, and publishing cadence. I’ll then deliver a complete quantitative Markdown report.
SignalDig research agent
The data is clear. I’ll add one essential control: engagement velocity (engagement per day), so a newly published post is not misclassified as weak simply because it has had less time to accumulate interaction.
SignalDig research agent
The data is sufficient. Next I’ll extract the full text of key posts for a post-by-post breakdown and adaptable examples; account identity, links, and company details will remain redacted.
SignalDig research agent
The analysis is complete. I’m upgrading the earlier findings to a quantitative report based on all 50 posts; before delivery, I’ll read the existing report and replace it with the updated Markdown version.
SignalDig research agent
The full quantitative Markdown report was delivered, based on 50 posts from 2025-11-07 through 2026-08-07. It includes two validated higher-engagement content lines, an engagement-velocity adjustment, topic priorities, publishing observations, three adaptable drafts, and a post-level appendix.
User
Add more page-level data.
SignalDig research agent
I’ll use the pagination_token returned on page one to fetch pages two and three, then compare older material with recent posts instead of treating the latest 50 as the account’s entire history.
SignalDig research agent
Page two returned 45 posts and a further token. Page three returned zero posts, so this returnable pagination chain is exhausted. The combined sample contains 95 posts from 2024-05-17 through 2026-08-07, spanning 812 days.
SignalDig research agent
I’ll update the Markdown report and monthly trend chart with the complete sample, adding an early-versus-recent comparison, a monthly trend table, and a Bottom 15 counterexample section. Content shape and engagement both change around June 2026; that is temporal alignment, not proof that a single series caused the growth.
01
Page one returned 50 posts from 2025-11-07 through 2026-08-07. Each was checked for likes, comments, reposts, publish time, text, and image fields; impressions were null on all 50. Following the page-one token returned 45 posts from May 2024 to October 2025; page three returned zero. The report therefore uses likes+comments+reposts and engagement per day, while explicitly treating readership as unverified.
02
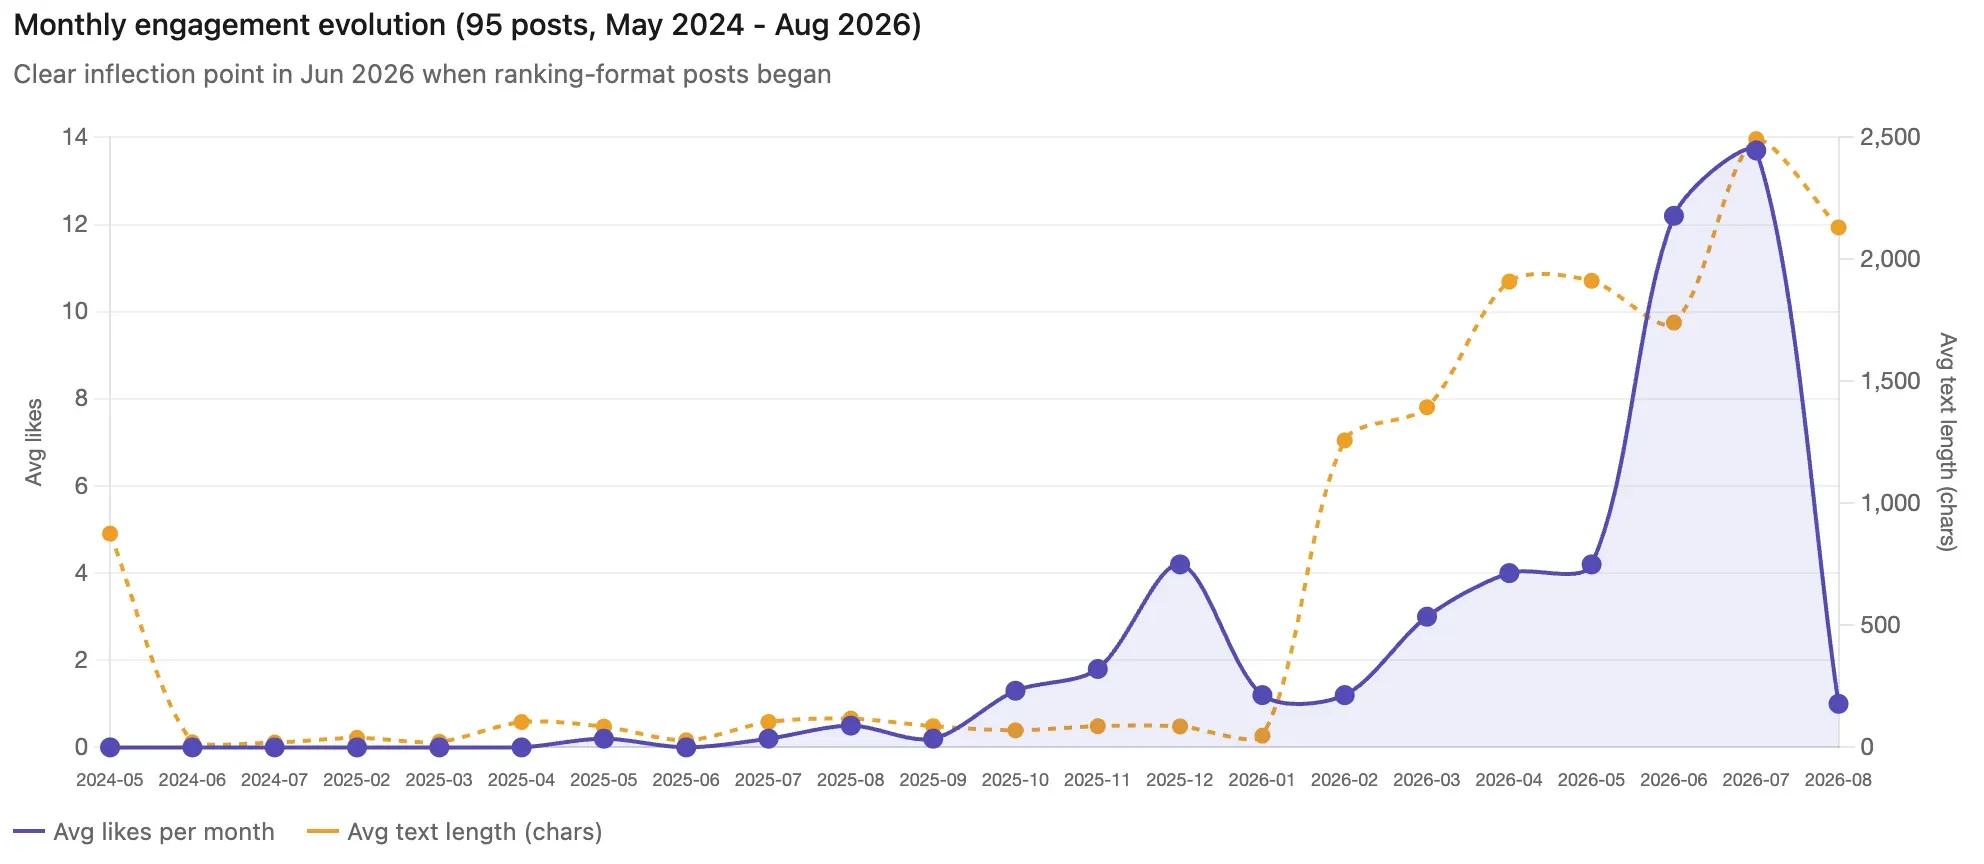
Across the 45 early posts, average likes were 0.20, 88.9% had zero likes, 95.6% were hashtag-only, mean text length was 139 characters, and image rate was 6.7%. Across the 50 recent posts, the corresponding figures were 5.9, 8.0%, 30%, 1,368 characters, and 68%. The comparison shows engagement and content format changing together; it does not isolate any one field as the cause.
03
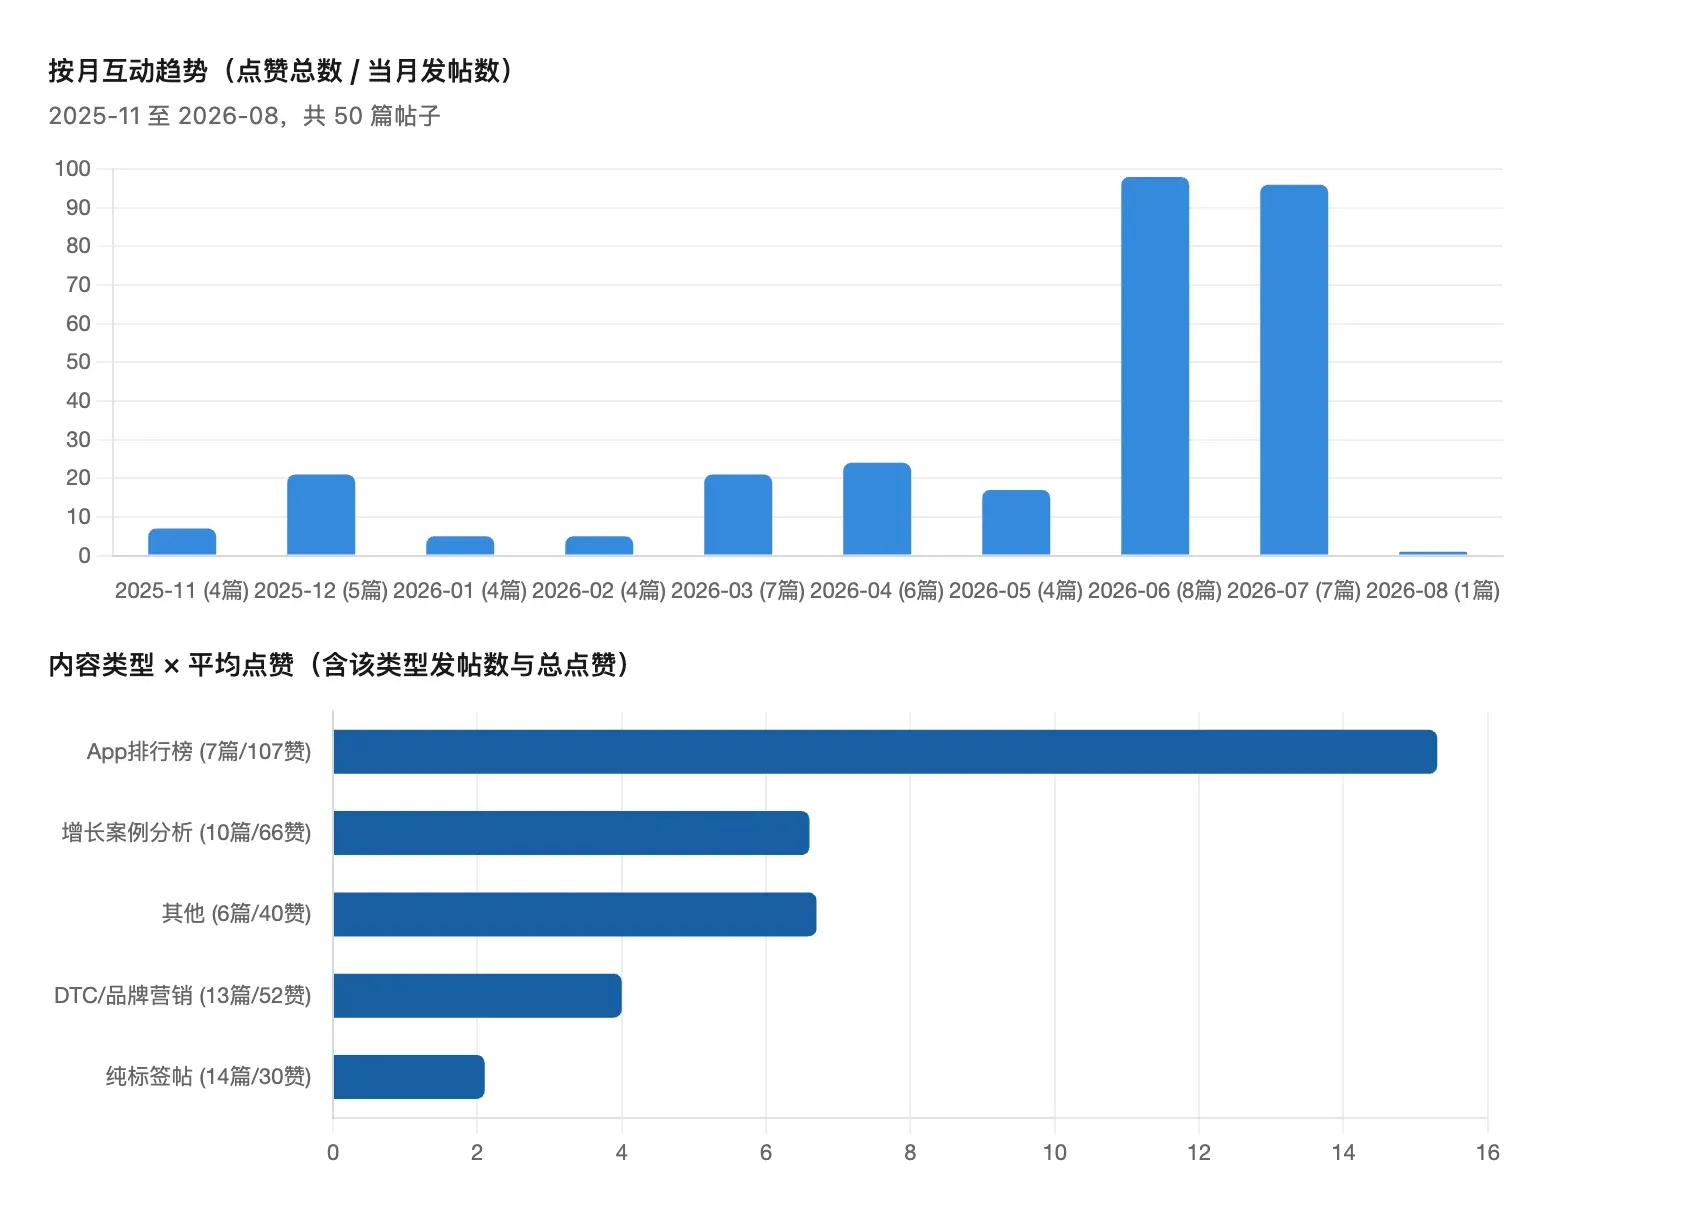
App-ranking posts averaged 15.3 likes across seven posts and carried 36% of all likes, while fourteen hashtag-only posts averaged 2.1. The comparison identifies a relative high-engagement line inside this account, not a platform benchmark.
04
June 2026 reached 98 total likes and 12.2 average likes; July average likes reached 13.7. May had 17 total likes and 4.2 average likes. The “Global Mobile App Revenue Top 30” ranking series began in June, and its first post earned 46 likes. With missing impressions and uncontrolled variables, this supports retesting the content line—not a readership, reach, or causal claim.
05
All eight high-engagement posts included images and had a 2,025-character median length; the 24 low-engagement posts had a 1,034-character median, and 14 hashtag-only posts generated just 30 interactions combined. After age adjustment, a single-App case post ranked first at 1.33 interactions per day. The report prioritizes App rankings and single-App cases and recommends stopping hashtag-only posts; this is account-level evidence, not a LinkedIn algorithm rule.
06
The updated Markdown report includes a 95-post appendix ranked by total engagement and engagement per day, content-type summaries, early-versus-recent comparison, a monthly trend table, Bottom 15 counterexamples, key-post text breakdowns, a data anchor → tension → structured points → takeaway → CTA formula, a topic matrix, and three drafts requiring human rewriting and fact checks. It records missing impressions, pagination scope, and the non-causal nature of the comparison.
Compare the closest verified executions before generalizing the conclusion.
$research-social-signals